For companies
Screen prospects and customers with official figures
Sales, finance and credit control work on the same lists, with the figures from the National Bank and the CBE.
Market analysis
TechFlow Solutions NV
BE 0789.456.123
Turnover
Turnover
€5.1M
+13.2%
Profit
€680K
FTE
47
+8
Sector position
P85 in sectorSimilar companies
Sound familiar?
Prospecting and credit control on the same figures
For sales, finance and credit teams that want to work with official figures.
Problem
- No overview of financial status of prospects in CRM.
- Data is scattered across Excel files and manual tools.
- No automatic tracking of updates for customers or leads.
- Limited insights when qualifying new opportunities.
- Lack of history on leadership changes or shareholder structures.
Solution
- Collaborate with multiple users on shared customer lists.
- Target prospects based on filters like sector, revenue, or region.
- View complete history of directors and shareholders.
- Get daily alerts for financial filings or mandate changes.
- Connect data to your own CRM or export with ease.
- Follow strategic accounts and see new opportunities sooner.
- Save time by automating repetitive manual research.
COMPANY LOOKUP
Screen business partners with official figures
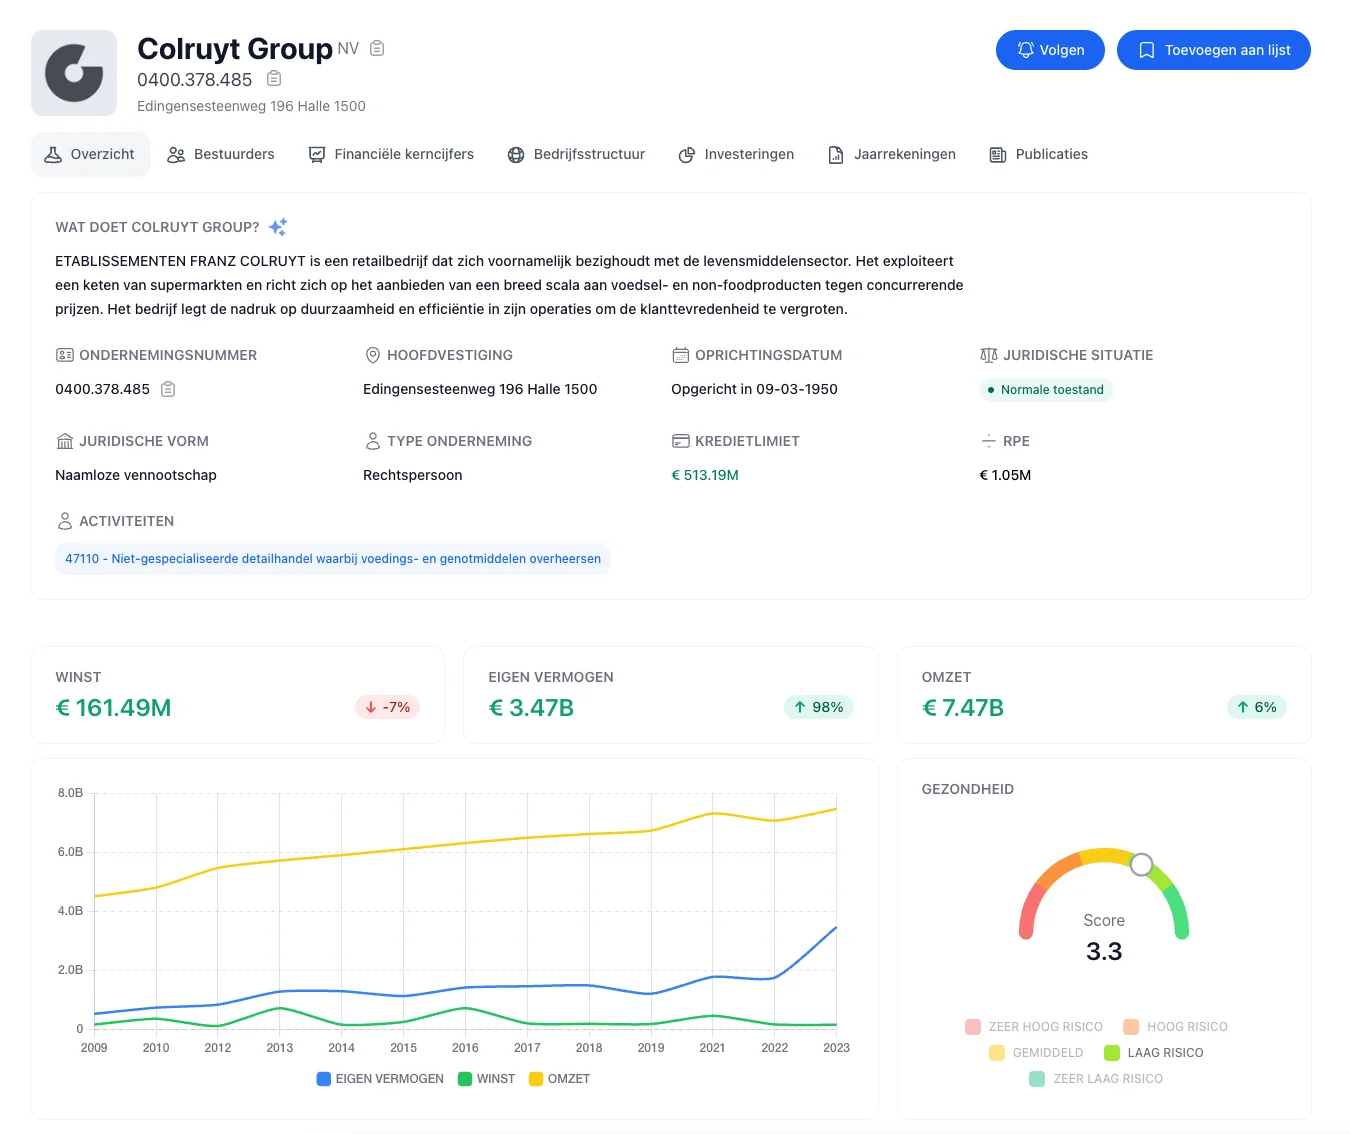
Look up any European company and get instant insight into key financials, directors, and corporate structure. Essential when closing new contracts, monitoring suppliers, or evaluating competitors.
- Comprehensive company profile
- All information in one place: address, activities, legal form, incorporation date, directors, and financial history.
- Financial overview
- Revenue, profit, equity, and debt ratios, summarised clearly so you can quickly gauge a company's financial health.
- Search by person
- Search by a director's name and see all companies in which that person holds a mandate.
CREDIT ASSESSMENT
Make data-driven credit decisions
Determine how much credit you can safely extend to a client or supplier. The credit assessment combines solvency, liquidity and profitability from the last three annual accounts into actionable advice.
- Recommended credit limit
- Receive a calculated credit limit based on the company's financial capacity, ready to apply directly in your internal processes.
- Risk classification
- Every company receives a health score from 1 to 5 and a risk label from very low to very high, based on solvency, liquidity and profitability.
- Historical trend
- Track how creditworthiness evolves over time. Anticipate deterioration before it's too late.
ALERT RULES
Find new companies that match your criteria
Set up to five alert rules with filters on location, sector, turnover or ratios. Every day Jaarrekening.be looks for new companies and changed figures that match and emails you the results. Share the same lists with your colleagues.
- Filter rules
- Combine location, sector, turnover, headcount and financial ratios in one alert rule.
- Daily or weekly by email
- Choose per rule whether you receive the new matches daily or weekly by email.
- Webhook integration
- Connect alert notifications directly to your CRM or internal systems via webhooks. Changes are processed automatically.
New companies in IT sector Antwerp
New companiesCompanies with solvency below 20%
FilterNew incorporations Ghent region
New companiesSIMILAR COMPANIES
Find companies similar to a client or competitor
Based on sector, size and location, you automatically get a list of similar companies. Useful for sector comparison, prospecting or expanding your portfolio.
- Matching by sector and size
- Companies are compared on NACE code, headcount, turnover and location.
- List enrichment
- Add similar companies directly to your lists or watchlist.
- Sector comparison
- Compare your company or client with similar players and see how they perform in terms of turnover, profitability and growth.
MAP & ACCESSIBILITY
Customers and prospects in your region on the map
Put customers and prospects on a map with drive-time zones and the average Health score per province (after logging in).
- Drive-time zones
- See which companies are reachable within 15, 30 or 45 minutes driving from a selected address.
- Provincial health score
- Switch to the province map and see the average Health score per province.
- Through to the company page
- Click a company on the map to go to its company page with key figures, score and directors.
How does Jaarrekening.be help companies?
All the tools for better-informed business decisions.
Team collaboration
Work together on company lists and share insights with colleagues from one platform.
Monitor clients & partners
Track the financial evolution of your clients, suppliers, and partners closely.
Health score
Every relationship gets a score from 1 to 5 and a risk label, calculated on the last three annual accounts.
Daily notifications
Receive an email every morning when the companies you follow file new annual accounts, change directors or publish in the Official Gazette.
Advanced search
Filter companies by sector, size, region or financial ratios with more than 30 filters.
Export & reports
Export company data and download reports for internal analysis or presentations.
Frequently asked questions
Can my team share lists?
Yes. Add colleagues to your subscription: they work on the same lists and see the same followed companies. Excel exports and alert rules are part of the Pro plan.
How do I set a credit limit per customer?
You do not set the limit yourself: Jaarrekening.be calculates a suggested credit limit for every company that has filed annual accounts, based on equity, liquidity and profitability over the last three financial years. You find it on the company page and in the risk report. It is a suggestion: your own payment experience and terms remain decisive.
Does this also work for French suppliers?
Yes. Besides Belgian companies, the database contains French companies with their annual accounts from the INPI register. Search by name or SIREN number. The Health score and key figures work the same way; shareholder data and Official Gazette publications are only available for Belgian companies.
Ready to start?
Get instant access to official annual accounts, company directors, and credit information for European businesses. No prior knowledge required.
Free account, no credit card needed. Try Pro free for 7 days.