Risk analysis
Know whether a customer or supplier is financially healthy
Health scores, signals, and credit assessment so you instantly know who you're doing business with.
Sound familiar?
From uncertainty to insight
Stop guessing. Assess financial health based on data.
Problem
- No clear picture of the creditworthiness of clients or partners.
- Manual risk assessments are time-consuming and error-prone.
- Important risk signals are not recognised in time.
- No benchmarks to compare companies with their sector.
- Lack of structured due diligence for new relationships.
Solution
- Automated health scores for every company.
- Visual signals highlight risks with colour codes.
- Credit assessment based on key financial figures.
- Compare companies with sector averages.
- Structured due diligence with all relevant data in one place.
- One score per company, readable even without an accounting background.
- Instant insight for every business decision.
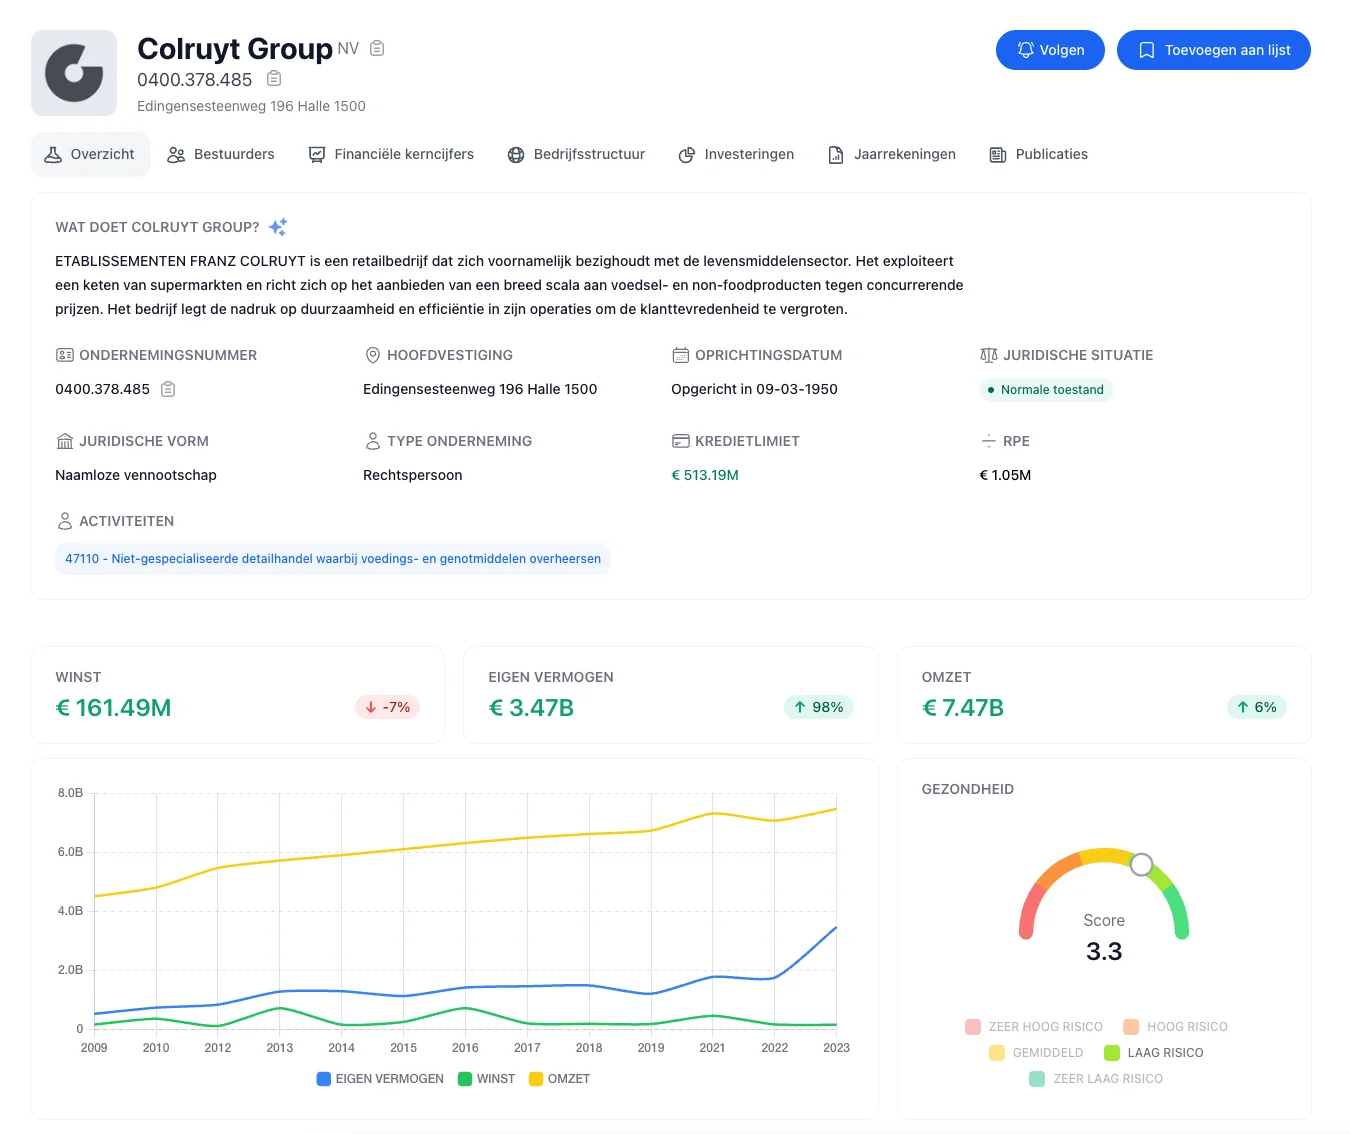
HEALTH SCORE
One score that summarises everything
The Health score weighs solvency (40%), liquidity (30%) and profitability (30%) from the last three annual accounts into one score from 1 to 5.
- Risk assessment
- Instant risk picture based on debt ratio, liquidity and signals from the annual accounts.
- Stability over three financial years
- The score looks at the last three annual accounts, so a single good or bad year does not distort the picture.
- Financial health
- Clear picture of profitability, liquidity, and stability.
SIGNALS
Recognise risks through visual signals
Signal badges automatically highlight important changes like capital decreases, losses, or board changes. So you never miss anything.
- Signal badges
- Visual warnings for changes in capital, management, or financial ratios.
- Risk classification
- Companies are automatically classified from very low to very high risk.
- Historical signals
- View which signals have occurred in the past for a company.
CREDIT ASSESSMENT
Assess creditworthiness for every relationship
Estimate creditworthiness based on the key figures from the latest annual accounts and the comparison with the sector.
- Credit limit
- Estimated maximum credit limit based on financial data.
- Payment capacity
- Assessment of the ability to meet obligations.
- Financial ratios
- Solvency, liquidity, and profitability in one overview.
DUE DILIGENCE
Screen companies thoroughly for every decision
Conduct background checks with board history, shareholder structures, and financial analysis in one place.
- Board history
- Complete history of directors, mandates, and departures.
- Shareholder structure
- Insight into shareholders and participation chains, with an indication of how transparent the ownership is.
- Publication check
- Overview of Belgian Official Gazette publications and filed documents.
SECTOR COMPARISON
Compare companies with their sector
Put financial performance in context by comparing with sector averages and competitors.
- Sector comparison
- See how a company performs compared to sector peers.
- Percentile scores
- Understand the relative position of each key figure within the sector.
- Trend analysis
- Compare evolution over multiple financial years with the sector average.
Everything you need for risk analysis
Score, signals, credit limit and sector comparison per company, based on the filed annual accounts.
Health score
One clear score summarising the financial health of any company.
Signal badges
Visual warnings for capital decreases, losses, or board changes.
Credit assessment
Estimate creditworthiness based on key financial figures.
Due diligence
Complete background check with directors, shareholders, and publications.
Sector comparison
Compare performance with sector averages for context and insight.
Risk indicators
Combination of financial ratios, signals, and scores for a complete risk picture.
Ready to start?
Get instant access to official annual accounts, company directors, and credit information for European businesses. No prior knowledge required.
Free account, no credit card needed. Try Pro free for 7 days.